At a glance
The eight terms parents ask about most. Tap a term to jump to it.
| Term | In one sentence |
|---|---|
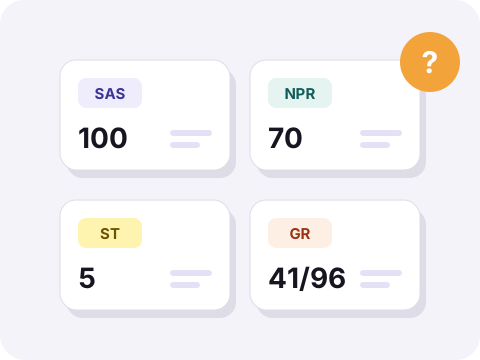
| SAS Standard Age Score | Compares your child with children of the same age; 100 is average. |
| NPR National Percentile Rank | How many out of 100 same-age children scored the same or lower. |
| Stanine (ST) “standard nine” | A 1-to-9 scale; 4 to 6 is average. |
| GR Group Rank | Your child’s place among the children tested at the same school. |
| 90% band Confidence band | The range in which your child’s true score very likely lies. |
| Bias Verbal–spatial profile | Whether your child learns more easily with words or with pictures. |
| Indicators Grade estimates | Statistical estimates for later exams – not a forecast. |
| Level X, Pre-A, A–G | The version of the test for your child’s year group. |
The scores
SAS – Standard Age Score
The most important number on the report. It compares your child with children of exactly the same age, in years and months. 100 is exactly average; about two thirds of children score between 85 and 115. An SAS is not a percentage – 100 does not mean 100% correct.
Example: An SAS of 108 is slightly above the average for your child’s age.
90% band
The range in which your child’s true score very likely lies. No test is perfectly precise. If the bands of two areas overlap, the difference between them may not mean much.
Example: “108 (101–115)” – the true score very likely lies between 101 and 115.
Mean SAS
The average of the four area scores. A useful summary – but the four separate scores show your child’s strengths far better.
NPR – National Percentile Rank
How many out of 100 same-age children scored the same or lower. 50 is exactly average. A percentile is not a percentage of correct answers.
Example: An NPR of 70 means your child did as well as or better than 70 out of 100 children of the same age.
Stanine (ST)
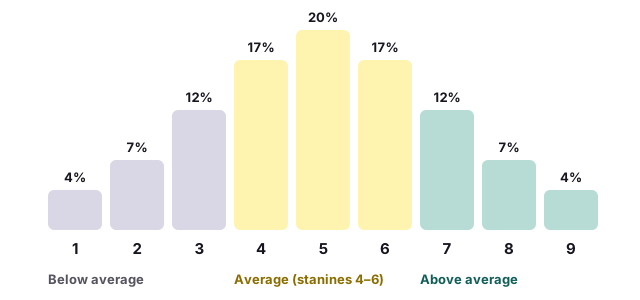
A simple scale from 1 to 9. Stanines 4 to 6 are average, 1 to 3 below and 7 to 9 above average. The yellow band in the report’s bar chart is exactly stanines 4 to 6.
| Stanine | SAS | Percentile | Description |
|---|---|---|---|
| 1 | below 74 | 1–4 | Very low |
| 2 | 74–81 | 5–11 | Below average |
| 3 | 82–88 | 12–23 | Below average |
| 4 | 89–96 | 24–40 | Average |
| 5 | 97–103 | 41–59 | Average |
| 6 | 104–111 | 60–76 | Average |
| 7 | 112–118 | 77–88 | Above average |
| 8 | 119–126 | 89–95 | Above average |
| 9 | 127 and above | 96–99 | Very high |
GR – Group Rank
Your child’s place among the children tested at the same school or in the same year group. At an academically strong school, a child can be above the national average and still sit in the middle of the group. That is normal.
Example: 41/96 means 41st out of 96 children.
What would your child’s scores be today?
The free starter test gives you an estimated SAS, stanine and strengths profile across all four CAT4 areas in about 10 minutes.
The profile
Profile
The bar chart with one bar per area. It has no numbers. A bar that ends inside the yellow band is average, to the right above average, to the left below average.
Bias (verbal or spatial)
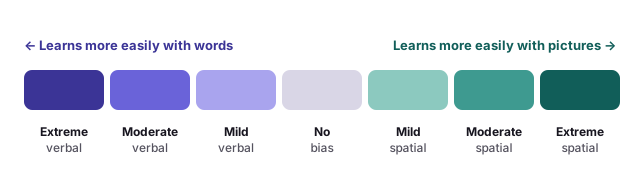
Whether your child learns more easily with words or with pictures. Teachers see one of seven labels, from “extreme verbal bias” through “no bias” to “extreme spatial bias”. No profile is better than another. A low verbal score can also simply mean that your child is still learning English.
Example: “Mild verbal bias” means the verbal score is a little higher than the spatial score.
Summary
The short text in the report about how your child prefers to learn. Children with a similar profile get almost the same wording, so read it as a starting point for a conversation with the teacher.
Want to read the whole report step by step? CAT4 results explained →
Indicators
The grade tables at the end of the report. Tap a term to open it.
Indicators and pointers
Estimated grades for later exams. Statistical estimates based only on the CAT4 result – not a forecast and not a ceiling.
“Most likely” and “If challenged”
The two columns in the indicator tables. “Most likely” is the grade your child is likely to reach, “If challenged” the grade possible with extra effort and challenge.
KS2
UK tests at the end of primary school. Reading, grammar and maths; scaled scores from 80 to 120, and 100 is the expected standard. Many international schools don’t sit them.
GCSE and A level
UK exams at about 16 and 18. They only matter if your child follows the British curriculum.
IB MYP and IB Diploma
Programmes of the International Baccalaureate. Look only at the table for the programme your child will actually follow.
The test and levels
CAT4
Cognitive Abilities Test, Fourth Edition. A test by GL Assessment that measures reasoning with words, numbers, shapes and space – not learned knowledge.
GL Assessment
The publisher of the CAT4. A UK company that also writes the parent report. MindScout is independent and not affiliated with GL Assessment.
Battery and subtest
The four parts of the test and their question types. The four batteries are verbal, quantitative, non-verbal and spatial. Each has two subtests, so the real test has eight question types. See all question types →
Level
The version of the test for your child’s year group. Nine levels: X, Pre-A and A to G. The school chooses the level. See the level table →
Example: A child in Grade 5 (Year 6) usually sits Level C.
Practice questions
Example questions at the start of each part. They are not scored and show how the question type works.
Questions attempted
How many questions your child answered in the time. If this is clearly lower than the total, your child may have run out of time.
Example: 48/48 means every question was answered.
Raw score
The number of correct answers. It is converted into age-based scores such as the SAS, because older children naturally answer more questions correctly.
Age-standardised
Compared with children of the same age. Age is shown in years and months, for example 12:04. The comparison group is a large sample of children in the UK.
Schools
Year and Grade
Two ways of counting school years. British schools count in Years, many others in Grades. Year is usually one higher than Grade.
Example: Year 7 = Grade 6.
KHDA
The schools regulator in Dubai. It requires private schools to run a cognitive abilities test, so many children sit the CAT4 in Grades 3, 5, 7 and 9 (Years 4, 6, 8 and 10).
Admission test
A test as part of applying to a school. Some schools ask for CAT4 results; many only use the CAT4 to plan teaching. Schools rarely publish minimum scores.
MindScout terms
Estimated SAS and stanine
Our estimate of your child’s current level from practice with MindScout. It becomes more reliable after three full practice sessions. It is not an official CAT4 result.
Target stanine
A goal you can set in the parent dashboard. The dashboard shows how far the current estimate is from it.
Atlas
Our AI tutor. Atlas explains the reasoning behind every question step by step.